
Reducing food waste has become a critical goal for businesses, governments, and consumers in the US. Up to 30–40% of the food supply in America is wasted at various stages of the supply chain – from farms and factories to grocery stores, restaurants, and households.
This waste not only represents huge lost revenue for businesses but also has major environmental impacts, such as greenhouse gas emissions and unnecessary water and energy use.
To address these challenges, many organizations are adopting data-driven strategies. In particular, food cost analytics is emerging as a powerful tool for identifying waste and improving efficiency.
By closely tracking food costs, inventory levels, and usage, businesses can pinpoint where waste occurs and implement targeted solutions. For example, managers using food cost analytics can identify that a particular ingredient or dish is responsible for a disproportionate share of waste costs.
Food cost analytics helps make the invisible costs of waste visible, enabling informed decision-making. This article examines how reducing food waste with food cost analytics can benefit industries like hospitality, retail, and agriculture, and offers practical strategies for implementation.
Understanding Food Waste
Food waste refers to edible food that is discarded or lost rather than consumed. It can occur at any stage of the food supply chain: on the farm (due to pests, weather, or production surpluses), in processing and distribution (due to spoilage or quality standards), at retail (unsold stock or imperfect produce), and at the consumer level (leftovers or items thrown away).
In the US, estimates indicate that about 30% to 40% of food produced ultimately goes to waste. For businesses, this waste translates into financial losses – food that was purchased or prepared but never sold or eaten.
Waste can take many forms: kitchen scraps from preparation, leftovers on plates, unsold prepared meals, or products that expire on shelves. By understanding where and why waste occurs, organizations can target those areas for improvement.
Key sources of food waste include:
- On farms or fields: Produce not harvested because prices fall, crops damaged by pests or weather, or items not meeting cosmetic standards. (Up to 20% of harvested produce may never make it to market.)
- During processing and packaging: Spills, trimming, or byproducts. For example, trimming vegetables can discard 10–30% of the edible weight.
- In transportation and storage: Spoilage from temperature fluctuations, shipping delays, or equipment failures. Poor refrigeration or long transit times can ruin perishable goods.
- At retailers and restaurants: Expired items, unsold inventory, or buffet and plate waste. Surveys find that the average American family wastes about $1,500 worth of food annually at home, and restaurants routinely discard a significant portion of prepared meals.
- In homes, hotels, and institutions: Food thrown out after cooking or eating, or excess prepared by large kitchens. For example, buffet-style dining and banquet services often over-prepare food, leading to later disposal.
Food loss vs. food waste: It’s useful to distinguish food loss (food lost during production and processing) from food waste (edible food discarded at retail or consumption). Both are problematic, but food cost analytics primarily targets the waste generated within businesses and supply chains where data can be captured and acted on.
Economic and Environmental Impact of Food Waste
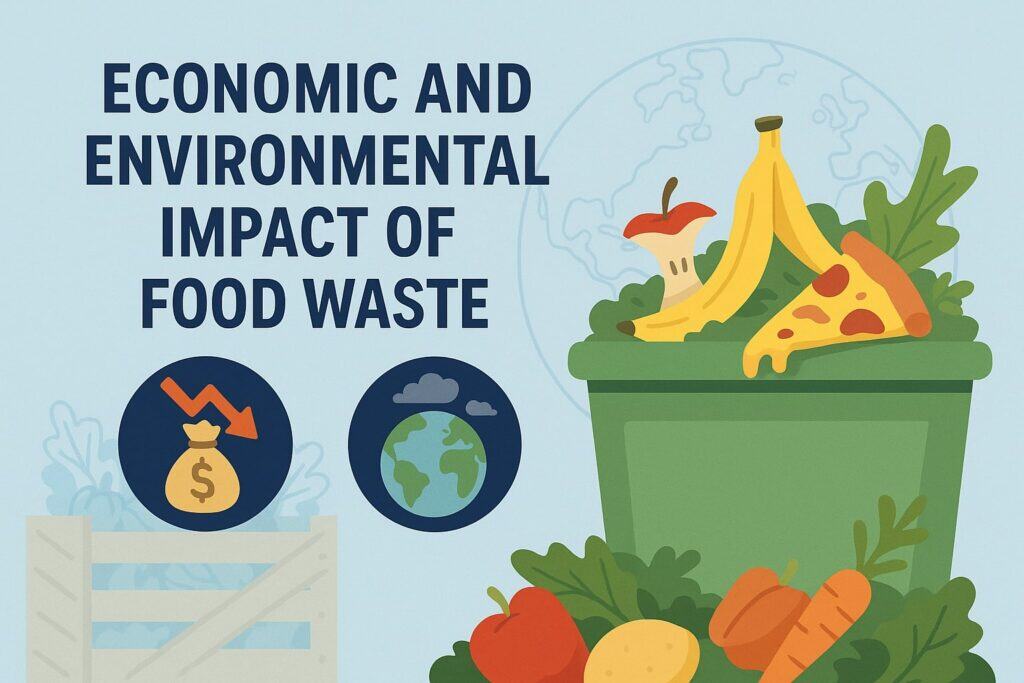
The cost of food waste is enormous. In the US alone, wasted food is estimated to cost businesses and consumers at least $161 billion each year in direct costs (and some analyses, including environmental externalities, put the total above $218 billion).
When restaurants, retailers, or producers throw away unsold or unused food, they effectively lose the money spent on ingredients, labor, transportation, and overhead.
Wasted food has a major environmental footprint: as it decomposes in landfills, it emits methane, a greenhouse gas far more potent than carbon dioxide. Estimates suggest that if global food waste were a country, it would rank among the top contributors to greenhouse gas emissions – on par with major industrial nations.
Reducing food waste conserves resources. Producing food uses a large amount of land and water – globally, wasted food accounts for roughly 24% of agricultural water consumption and uses farmland in an area the size of France.
In the US, food waste contributes about 6% of all greenhouse gas emissions. By cutting waste, businesses shrink their environmental footprint and advance sustainability goals. For example, lowering waste helps companies reduce their reported Scope 3 emissions (those from the supply chain).
There are also economic benefits for consumers. Lower waste often translates to lower costs. In the hospitality sector, unnecessary waste drives up menu prices to cover losses. If waste is cut, restaurants and grocery stores can offer fresher food and potentially pass savings on to customers.
Across the food industry, implementing waste reduction can improve supply chain efficiency and even lead to new business models (like selling surplus food), improving overall profitability.
Governments and organizations have set targets to address the problem. The US has pledged to halve food waste by 2030 (in line with the UN Sustainable Development Goals 12.3).
Many cities now require large businesses to divert organic waste (through donation or composting) and offer grants or tax incentives for companies adopting waste-reduction technologies.
This regulatory environment creates incentives for businesses to adopt analytics-driven solutions and transparently report progress.
What is Food Cost Analytics?
Food cost analytics refers to the use of data analysis to understand and manage the costs associated with buying, preparing, and selling food. It involves collecting and analyzing data on ingredient purchases, inventory levels, recipe yields, and sales. This data is used to calculate key metrics, such as:
- Food cost percentage: The ratio of the cost of ingredients to menu sales revenue. A high percentage may indicate excessive waste or pricing issues.
- Waste ratio: The percentage of total food usage that is ultimately discarded.
- Portion cost: The cost of ingredients required to produce one portion of a menu item.
- Yield: The amount of edible product obtained from raw ingredients (e.g., weight of usable chicken meat after deboning).
- Inventory turnover: How quickly perishable stock moves through inventory.
By analyzing these metrics, businesses can identify inefficiencies. For example, if one dish consistently has a high waste ratio or its food cost percentage far exceeds the norm, managers can investigate why – perhaps adjusting the recipe, portion, or ingredient sourcing.
Food cost analytics makes it possible to assign a dollar value to waste, highlighting exactly how much money is being lost when food is discarded.
Data sources for food cost analytics include:
- Purchasing records and invoices (capturing ingredient costs).
- Inventory management systems (tracking stock levels and expiration dates).
- Recipe databases (defining the quantity of each ingredient per dish).
- POS (Point-of-Sale) systems (recording each item sold).
- Waste tracking logs or sensor data (recording discarded food by type or station).
In summary, food cost analytics provides actionable intelligence: it answers questions like “How much money was lost to waste last week?” or “Which ingredient is causing the most scrap?” By converting waste into hard numbers, businesses can prioritize solutions.
Additionally, these analytics systems often include forecasting functionality: using historical sales and external factors (seasonality, local events, weather) to predict how much of each item will be needed. This helps in planning production and ordering, further reducing the likelihood of excess that becomes waste.
Technologies for Food Cost Analytics
Food cost analytics relies on a suite of tools and technologies to collect and process data. These include:
- Smart scales and waste sensors: IoT-enabled kitchen scales and bins automatically weigh discarded food. Every time a chef throws away scraps or a server clears plates, the amount is logged digitally.
Over time, this builds a detailed profile of waste by ingredient, station, or dish, without requiring manual entry. - Inventory and procurement software: Digital inventory systems track stock levels, usage, and reorder points. When integrated with purchasing data, these tools can alert managers to overstocking risks (e.g., too many dairy products ordered) or impending expirations, preventing spoilage.
- Point-of-Sale (POS) integration: Linking POS data to inventory and recipe databases allows precise demand tracking.
When every sale is matched to the ingredients it consumed, businesses get accurate visibility into how much of each item needs restocking and which menu items drive the most usage. - Data analytics platforms: Cloud-based analytics and business intelligence (BI) tools aggregate large datasets.
Dashboards can reveal trends (such as which day of the week sees the highest waste) or correlations (for example, high waste on certain shifts). Managers use these insights to make operational adjustments. - Machine Learning and AI: Advanced systems apply machine learning to improve predictions.
For instance, an AI model might combine weather forecasts, local event calendars, and historical sales to predict next week’s demand for sushi. Over time, the model learns from errors and refines its accuracy, further cutting overproduction. - Mobile apps and dashboards: Managers and staff can access data on tablets or phones. Real-time alerts (e.g., “Chicken inventory is 20% over forecast”) allow quick reactions. Clean, user-friendly dashboards help teams identify issues at a glance.
- Barcode/RFID tracking: Some operations tag ingredients with barcodes or RFID chips. Scanning items at reception and usage creates a precise flow of goods. This end-to-end traceability feeds directly into the analytics, improving accuracy.
Together, these technologies turn raw information into actionable insights. For example, if analytics indicate that lettuce was the #1 waste item this week, a manager might switch to pre-chopped lettuce or adjust the salad recipe.
By connecting kitchen processes (like trimming vegetables) with financial data (cost per pound), food cost analytics makes it clear exactly how waste is impacting the bottom line.
Food Cost Analytics in the Hospitality Industry
Food cost analytics is particularly powerful in the hospitality industry (restaurants, hotels, catering) because food costs represent a huge share of the budget. For example, a restaurant might spend 30%–35% of its revenue on food.
Wasting even a few percentage points of that can significantly erode profits. Food cost analytics helps hospitality businesses reduce waste through data-driven strategies. Examples include:
- Accurate demand forecasting: By analyzing reservations, historical sales, and local events, restaurants can better predict how many guests to serve. For instance, if data shows that a rainy Sunday normally has 20% fewer diners, the kitchen can prepare less food in advance, avoiding overproduction.
- Recipe and menu optimization: Analytics reveal which dishes have high waste or low profit margins. If a certain entrée requires large quantities of ingredients that often end up as leftovers, managers can tweak the recipe or even remove the dish.
For example, a seafood pasta generating many unused shellfish may be replaced with a different dish that customers prefer and finish. - Portion control and menu engineering: Detailed cost data allows chefs to fine-tune portion sizes. Restaurants might introduce smaller portion options (e.g., half-sized entrees or sides) to match customer preferences. This prevents over-portioning and plate waste without sacrificing customer satisfaction.
- Waste-tracking programs: Many establishments implement waste logs. For instance, kitchen staff might record daily scrap weights by category (vegetable trim, meat scraps, etc.).
Over time, managers see clear patterns (e.g., the salad station wastes mostly lettuce cores), enabling targeted action like switching to pre-trimmed greens. - Staff training and incentives: Sharing analytics with staff raises awareness. When cooks and servers know that, say, 10 pounds of food were wasted last week (costing $50), they often find creative ways to reduce it. Some restaurants even run competitions, rewarding teams that show the greatest waste reduction on their shift.
- Donation of surplus: Food cost analytics quantifies daily surplus. For example, if a hotel breakfast buffet typically has 100 unsold pastries, the data can trigger a partnership with a local shelter to collect them each morning. Tracking these donations also provides tax benefits and public relations value.
- Composting and recycling: Analytics help quantify unavoidable waste. A kitchen might find it composts 200 pounds of peels and leftovers weekly. With this information, it can invest in in-house composters or arrange for municipal pickup, turning waste into a resource.
These strategies pay off. Industry reports suggest that restaurants using analytics-driven waste programs can cut food waste by 15–30%. This directly translates to cost savings (buying less excess food) and can even reduce labor (less time spent cooking and discarding extras).
Importantly, it also helps meet growing customer demand for sustainable practices: modern diners appreciate restaurants that use food responsibly.
Food Cost Analytics in the Retail Sector
Grocery chains and food retailers also leverage food cost analytics to manage perishable inventory and reduce waste. While the scale of products is larger, the goal is the same: align supply with demand and avoid unsold goods. Key approaches include:
- Predictive ordering: Retailers analyze historical sales data (often refined by day of week, season, and local events) to forecast how much of each product to stock.
For example, if analytics predict higher demand for grilling supplies ahead of a heat wave, a supermarket can order extra barbecue items and avoid shortages or leftovers. - Dynamic pricing and promotions: When analytics detect that a product is nearing its expiration date and not selling, the system can trigger markdowns or promotions to clear it.
For instance, if data shows a batch of yogurt is one day from “sell-by”, the price might drop 30% automatically. These targeted discounts help sell items that would otherwise become waste. - Assortment optimization: By comparing performance across stores, retailers identify which products underperform and cut those from the lineup.
Data might reveal that one store’s walnut bread expires unsold frequently, while another location sells it out. Analytics can then tailor orders per store, reducing region-specific waste. - Inventory management: Just-in-time ordering, informed by analytics, keeps stock levels lean. Instead of one big weekly order, a retailer might receive daily small deliveries.
Inventory software with analytics can also set reorder alerts based on real-time sales trends, preventing both overstock and stockouts. - Supplier collaboration: Retailers often share demand forecasts with suppliers through integrated data platforms. If a supermarket chain predicts a spike in berry sales, the supplier adjusts production.
This coordination means suppliers produce just what is needed, reducing the odds that excess perishables will spoil before sale. - Loss and waste analysis: Retail “shrink” includes spoilage. Food cost analytics drills down into shrink specifically for perishables, attributing losses to causes (e.g., poor handling, over-ordering). Addressing these root causes (like adjusting storage procedures) further cuts waste.
- Corporate sustainability reporting: Many national chains use analytics to generate waste reduction reports. They might publish metrics like “we reduced food waste by 20% year-over-year,” based on the data tracked through their analytics systems.
By using these methods, retailers keep shelves stocked with what customers actually want, minimize waste, and improve margins.
For example, one supermarket chain reported a 15% reduction in bakery waste after implementing data-driven ordering. Consumers also benefit from better prices and fresher produce when retailers operate more efficiently.
Food Cost Analytics in Agriculture and Food Production
Food waste and loss begin on the farm. Producers are increasingly using analytics tools to prevent waste before it happens:
- Crop planning: Farmers can use market and cost analytics to decide which crops to plant and in what quantities. If demand forecasts or price signals suggest a glut of a certain vegetable next season, they might allocate acreage to something else.
For example, if analytics indicate a drop in corn prices, a farmer might plant more soybeans instead, avoiding a surplus that could rot in storage. - Precision agriculture: Data from soil sensors, drones, and satellites allow variable-rate planting and watering. Analytics help match inputs to plant needs, reducing under- or over-production.
For instance, if sensor data shows uneven moisture, irrigation can be adjusted to prevent sections of a field from failing (and thus being lost). - Harvest timing: Analytics can recommend optimal harvest times by balancing crop maturity against market demand. If models predict that tomatoes will fetch a higher price in three days, farmers might delay harvest. Conversely, if a severe weather event is predicted, they can expedite harvest to prevent loss.
- Post-harvest handling: Modern storage facilities use analytics-driven climate control (managing temperature and humidity) to extend shelf life.
For example, apples stored under analytics-managed conditions can stay fresh weeks longer, reducing the percentage that must be discarded. - Direct marketing: Some farms use analytics-based platforms to take pre-orders (like Community Supported Agriculture subscriptions). By knowing exactly how much demand exists, they harvest only what has buyers, drastically reducing leftover produce.
- Byproduct utilization: Processing plants also apply analytics. For instance, a juice manufacturer may use food cost analytics to analyze the yield from fruit shipments.
If a particular supplier consistently yields extra juice per unit weight, the plant can source more from them and waste less pulp. Alternatively, waste streams can be tracked to find new uses (e.g., tomato peels can become animal feed or compost).
By employing these strategies, producers turn what was once waste into either additional revenue (selling more of each harvest) or secondary products.
Food cost analytics in agriculture is still developing, but it is enabling a shift from reaction to prediction—helping growers make crop decisions that match real demand and minimize losses.
Food Cost Analytics for Supply Chain and Logistics
Analytics also optimizes the broader food supply chain, further cutting waste before it ever reaches store shelves or kitchens:
- Real-time tracking: With GPS and RFID-enabled shipments, companies know exactly where each food batch is in transit.
Analytics platforms can detect delays or deviations early. For example, if a refrigerated truck is delayed, the system can suggest rerouting to a closer drop-off or moving goods to another truck to preserve freshness. - Inventory distribution: Logistics analytics balance stock across warehouses and stores. If one supermarket has excess milk near expiry and another has demand, a transfer can be arranged. This ensures inventory is sold rather than discarded.
- Route optimization: Delivery routes are planned using analytics to minimize travel time and keep perishables fresh.
Systems factor in traffic, weather, and driver schedules so that food spends the least time in transit. Shorter routes mean less time for products to deteriorate. - Quality monitoring: Sensors in trucks and storage continuously log conditions (temperature, humidity). Analytics platforms watch these feeds.
If a refrigerated container’s temperature creeps up, managers are alerted to act (for example, by prioritizing delivery of those goods), preventing spoilage. - Loss prediction: By analyzing past incidents (equipment failures, spoilage events), analytics can predict where losses are likely.
A data-driven system might flag that a certain depot frequently has temperature issues and recommend maintenance or process changes.
Taken together, these supply chain innovations make every link smarter. For example, one dairy distributor uses analytics to predict that summer afternoon heat increases delivery risk.
They now schedule deliveries for early morning instead, reducing spoiled milk. In this way, food cost analytics extends into logistics, treating time and conditions as key “ingredients” in preserving food’s value.
Policy, Regulation, and Food Cost Analytics
Policies and regulations increasingly encourage data-driven waste reduction:
- Mandatory waste audits: Some jurisdictions require large food businesses to measure and report their waste. Analytics platforms simplify this by automatically compiling required data.
When a new law demands reporting of tons of organic waste generated each year, companies adopt food cost analytics tools to gather the numbers. - Donation incentives: Legislation like the Good Samaritan Act in the US protects and encourages food donation.
Businesses get tax deductions based on the value of donated food, which must be documented. Food cost analytics systems can track quantities and values of food donated, making it easy to claim these benefits. - Reporting requirements: Sustainability standards and local ordinances often require waste tracking. For example, a city might mandate that restaurants report their weekly composted vs. landfilled food weight.
Analytics dashboards can be configured to generate such reports automatically, ensuring compliance without manual effort. - Government programs and grants: Agencies may run initiatives (like EPA’s Food Recovery Challenge) where businesses use analytics to set reduction targets. Funding or recognition is given based on data-driven results.
For instance, a municipality grant program might reimburse restaurants that show they reduced food waste by 25% using analytics tools. - Tax incentives: In many places, businesses can write off the cost of food donated to charities. Accurate food cost analytics records (showing cost per pound of donated items) maximize these deductions.
Knowing the exact inventory and cost data of donated goods ensures businesses take full advantage of tax laws. - Labeling and standards: Confusing date labels (“sell by” vs. “use by”) contribute to waste. While analytics can’t change labels, companies can model the impact of different labeling on waste generation.
Data may inform lobbyists or internal policy to adopt clear labeling (like “best if used by”) that can meaningfully reduce unnecessary disposal.
In summary, regulations often create the need for precise waste data, effectively steering businesses toward food cost analytics. Companies using these tools can not only avoid penalties but also qualify for incentives, making analytics adoption part of a smart compliance strategy.
Consumer Engagement and Impact
Consumers indirectly influence food waste reduction through their preferences and behaviors, and food cost analytics helps align business practices with consumer values:
- Demand signals: Retailers and restaurants analyze purchase data (for example, from loyalty programs or online ordering) to understand trends.
If analytics show rising consumer interest in vegetarian meals, a restaurant may offer more vegetable-based dishes, reducing the chance of meat entrees going unsold. - Apps and platforms: Consumer-facing apps help households cut waste by planning shopping and meals. Some grocery stores integrate analytics with mobile apps: if a customer buys a product near its expiry, the app might alert them to use it soon.
Restaurants may use reservation apps that track ordering history to suggest portion sizes, reducing leftover waste. - Waste-sharing services: Platforms like Too Good To Go or local food-sharing networks use data to connect sellers and buyers of surplus food. Analytics on expected surplus inventory help these platforms schedule pick-ups or promote items.
For example, a bakery might list discounted unsold bread each afternoon based on analytics forecasts of end-of-day stock. - Education and transparency: Businesses often share their sustainability efforts with customers. For instance, a grocery chain might display a sign saying, “We saved X pounds of food from waste last month with smart ordering.” These claims are backed by analytics data and appeal to eco-conscious shoppers.
- Direct-to-consumer models: Farmers’ markets and co-ops sometimes use analytics loosely by tracking demand (e.g., how many pre-orders for a crop) to decide how much to harvest.
This prevents unsold farm stand goods. Even restaurants can offer “pre-order specials,” using reservation or order analytics to prepare exactly the number of special dishes needed. - Household analytics: On the consumer side, smart refrigerators and shopping list apps function like personal food cost analytics tools.
They track what’s in the fridge, remind users of expiring items, and suggest recipes to use ingredients, helping reduce home food waste.
By making consumer needs visible in data, businesses use food cost analytics to supply what customers really want. This feedback loop means less food is overproduced and more is actually eaten.
The collective impact is significant: as consumers demand transparency and waste reduction, more companies will adopt analytics to meet that expectation, creating a virtuous cycle.
Implementing Food Cost Analytics: Best Practices
To harness food cost analytics for waste reduction, businesses should follow a structured approach:
- Conduct a waste audit: Begin by measuring current waste levels. Over a week or two, track everything that is discarded (by weight or volume) across all areas. This baseline quantifies the scope of waste and provides concrete data to compare future improvements.
- Set clear goals: Use baseline data to define targets. For example, aim to “reduce kitchen waste by 20% within six months” or “save $X in food costs per month.” Choosing specific metrics (like waste pounds per meal or food cost percentage) makes it possible to measure progress.
- Invest in the right tools: Start with simple tracking (spreadsheets, barcode scans) and scale up. Modern food cost analytics software ranges from basic inventory apps to full-featured platforms that integrate POS, purchasing, and waste tracking.
Even a simple digital inventory system can provide dashboards and alerts to guide decision-making. - Train and engage staff: Ensure that chefs, servers, and inventory managers understand the importance of reducing waste. Provide clear procedures for inventory counts, portioning, and waste logging.
When staff are involved in tracking (for instance, recording waste in an app), they are more aware of waste issues. Some businesses tie small bonuses or recognition to hitting waste reduction goals, motivating teams. - Improve purchasing and inventory: Use analytics to optimize ordering. Implement First-In, First-Out (FIFO) to rotate stock.
Adjust order quantities based on analytics forecasts (for example, cutting orders slightly for items selling slower than usual). Proper inventory management directly reduces spoilage. - Optimize menus and recipes: Analyze which dishes have high food costs or create excess scraps. Revise recipes to use ingredients more efficiently (e.g., using whole vegetables instead of heavily trimmed cuts) and consider removing dishes that consistently underperform or waste too much. Menu engineering with data ensures that offerings match customer demand.
- Monitor progress: Regularly review food cost analytics dashboards. Track metrics like food cost percentage, waste weight, and inventory turnover.
Look for anomalies (such as waste spikes) and investigate causes promptly. Continuous monitoring means small issues are caught early, preventing large losses. - Collaborate with partners: Share relevant forecasts with suppliers and coordination with waste recyclers.
For example, if analytics predict a big drop in demand next week, inform your supplier to adjust deliveries. If you consistently have donations of a particular food, partner with a local charity on a regular pickup schedule. - Regular review meetings: Hold weekly or monthly meetings to discuss the analytics. Involve cross-functional teams (kitchen, purchasing, finance).
Use the data to make decisions: for instance, decide if a menu change should become permanent based on a data-driven trial. - Continuous improvement: Use analytics to experiment. For example, try running a day with smaller portion sizes or a new ordering rule and compare waste levels. Analyze the before-and-after data. This iterative approach (plan-do-check-act) drives steady progress in reducing waste.
By following these steps, businesses turn food waste reduction into a data-driven process. Small changes guided by analytics add up, leading to significant reductions in waste and cost over time.
Future Trends and Innovations
The future of food cost analytics is bright, driven by technological and social trends:
- AI-driven precision: Artificial intelligence will make analytics platforms even smarter. Chefs and managers might use natural language interfaces (voice or chat) to query waste data or get recommendations.
AI could dynamically adjust production; for example, an AI assistant might tell a bakery “bake 10 more loaves today” based on live sales data, minimizing unsold bread. - IoT and pervasive sensors: As sensor costs drop, kitchens and stores will be filled with connected devices. Smart refrigerators might track contents and expiration dates.
Sensors on shelves could detect when items are nearly gone or expiring, automatically updating the analytics system. In homes, smart scales could log discarded food, linking household waste to broader analytics. - Blockchain and transparency: End-to-end traceability using blockchain could integrate with analytics. Consumers might scan a QR code to see a product’s journey and the waste savings achieved.
For businesses, immutable records could certify their analytics data, building trust and facilitating multi-stakeholder collaboration. - Circular economy integration: Analytics will help businesses close the loop on waste. For example, data might show how much organic waste a restaurant produces, and algorithms could calculate the energy yield if converted to biogas.
Companies may apply the same analytics mindset to resource recovery, ensuring waste streams become inputs for new products. - Integrated sustainability metrics: Environmental impact data will join financial data. Companies may start tracking “carbon cost per menu item” or “water footprint per recipe,” all tied into their analytics systems. This allows simultaneous optimization of waste and sustainability goals.
- Smart appliances and kitchens: The line between analytics and equipment will blur. Ovens and grills may auto-adjust cooking times based on inventory data, while automated portioning machines ensure exact serving sizes.
The kitchen of the future will behave almost autonomously, guided by live analytics feedback. - Data sharing platforms: We may see industry-wide analytics platforms where anonymous data is aggregated.
For example, restaurants of a certain cuisine type could compare waste benchmarks to improve collectively. Benchmarking against peers will raise the bar for waste reduction. - Consumer-connected analytics: Meal kits, grocery delivery services, and nutrition apps will contribute data. For instance, a meal planning app might sync with your local store’s stock (via analytics) to plan perfectly sized shopping lists, further reducing waste at the consumer level.
In summary, the integration of big data, AI, IoT, and sustainability into food cost analytics will make waste reduction more precise and automated. As technology evolves, businesses that embrace food cost analytics will stay ahead of competition, achieving efficiency, profitability, and environmental leadership.
Frequently Asked Questions (FAQs)
Q: What is food cost analytics and how does it reduce food waste?
A: Food cost analytics is the practice of using data on purchases, recipes, inventory, and sales to understand and manage food expenses.
By analyzing this data, businesses can identify where waste is occurring – for example, which ingredients are discarded or which dishes are underperforming. This allows them to adjust purchasing, menus, and portion sizes to minimize waste.
In short, food cost analytics makes the invisible costs of waste visible, so informed decisions can be made to reduce it.
Q: Why is reducing food waste important for restaurants and grocery stores?
A: Reducing food waste is crucial because it directly affects both profitability and sustainability. For restaurants and hotels, food can be one of the largest controllable expenses, and wasted food means lost revenue on ingredients and labor.
In retail, unsold perishables erode profit margins. Additionally, regulators and consumers increasingly demand environmental responsibility.
Cutting food waste with analytics helps businesses save money, meet regulatory targets, and enhance their reputation as eco-friendly operations.
Q: What technologies help businesses track and reduce food waste?
A: Several technologies enable waste reduction through analytics. Smart scales and bin sensors can automatically log discarded food weights. Inventory management and POS systems track stock levels and sales, integrating with analytics software.
Advanced platforms use machine learning to forecast demand and optimize ordering. Mobile apps and dashboards provide real-time insights to staff. Together, these tools turn raw waste data into actionable insights, forming the backbone of food cost analytics.
Q: Can small businesses use food cost analytics effectively?
A: Yes. Even simple data practices can benefit small businesses. A small cafe or grocery store might start by manually tracking waste (for example, weighing discarded food) and comparing it against purchases.
Spreadsheet tools or basic inventory apps can calculate metrics like food cost percentage. Over time, these simple analytics reveal patterns (e.g., too much bread is going to waste).
Many analytics solutions offer scaled versions for small operations, and even a whiteboard with daily waste totals is a low-tech form of food cost analytics that can spark improvements.
Q: Which industries can benefit from food cost analytics?
A: Any industry dealing with food production, distribution, or service can benefit. This includes hospitality (restaurants, hotels, catering), retail (grocery stores, supermarkets, and food distributors), agriculture and farming, food processing, healthcare dining services, schools and universities, and food delivery services.
Even municipal entities (like city-owned cafeterias) can use these techniques. Anywhere food is bought, stored, or sold, food cost analytics can reveal waste patterns and improve efficiency.
Q: How do I get started with food cost analytics in my business?
A: Begin by measuring your current food usage and waste. Keep a simple log of what you purchase and what gets thrown away. Even basic tools like spreadsheets can help set up initial metrics (such as food cost percentage or waste per week).
Once you have baseline data, you can gradually introduce more sophisticated tools (POS integration, waste-tracking apps, inventory software) to automate data collection. Training staff on accurate record-keeping is crucial.
Over time, analyze the data to spot trends (e.g., recurring waste hot spots) and adjust operations accordingly.
Q: How much money can be saved by reducing food waste with analytics?
A: Reducing food waste even by a small percentage can have a large impact on a business’s bottom line. For example, if a restaurant has $50,000 in food costs per month, a 10% reduction in waste could save $5,000 monthly.
These savings come from buying only what is needed, using staff time more efficiently, and lowering waste disposal fees. In retail, every unsold item converted to sale is pure gain. Over time, the cost savings often justify investments in analytics tools many times over.
Q: Are there industry standards or certifications related to food waste reduction and analytics?
A: Yes. Environmental management standards like ISO 14001 encourage tracking and reduction of waste. Organizations such as the Green Restaurant Association or similar bodies offer recognition to businesses that meet sustainability criteria (including waste reduction).
Programs like the EPA’s Food Recovery Challenge guide companies to measure and reduce waste. While not all specifically mandate analytics, these standards encourage the type of data collection and continuous improvement that food cost analytics represents. Meeting them often involves using analytics tools to document progress.
Conclusion
Reducing food waste with food cost analytics is a win-win strategy. It saves money and resources by turning data into decisions. With the right tools and practices, businesses in hospitality, retail, agriculture, and beyond can significantly cut waste.
Tracking food costs reveals inefficiencies that might otherwise remain hidden. From optimizing menus and orders to designing smarter supply chains, analytics empowers stakeholders at every level to waste less. The result is lower operating costs, more efficient operations, and a lighter environmental footprint.
Food cost analytics brings transparency and accountability. Restaurants see which menu items cost the most in waste; grocery stores spot which products frequently expire on shelves; farmers align planting with demand.
In each case, analytics turns guesswork into measurable factors. This not only helps businesses hit their financial goals but also contributes to broader sustainability targets, such as reducing greenhouse gas emissions from wasted food.
As companies embrace these data-driven approaches, they improve their bottom line and demonstrate corporate responsibility. For restaurant owners, supply chain managers, and policymakers in the US and beyond, leveraging food cost analytics is key to building a more sustainable and profitable food system.
The future of food management is data-driven, with food waste reduction at its core. By adopting food cost analytics, stakeholders at all levels can ensure that less food – and less money – goes to waste.